Question ID - 103074 | SaraNextGen Top Answer
Sketch shows the plot of 
three distinct temperature
.png)
Boyle’s temperature is the temperature at which a gas shows ideal behaviour over a pressure range in the low pressure region. Boyle’s temperature  . If a plot is obtained at temperature below Boyle’s temperature then the curve will show negative deviation in low pressure region and positive deviation in the high pressure region. Near critical temperature, the curve is more likely as
  and the temperature above critical temperature curve is more like
 at
at 
|
For 500 K plot value of |
|||||||
|
a) |
|
b) |
|
c) |
|
d) |
|
 changes from 2 to 2.2 if pressure is varied from 1000 atm to 1200 atm (high pressure) then the value of
  will be


|
(b) We know that In the high pressure region
Solving both the equation we get |

 …(i)
…(i)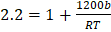 …(ii)
…(ii)
Answer Link
1. Are the solutions and answers provided on SaraNextGen.com verified?
Most answers are prepared or reviewed by subject experts and experienced educators, ensuring they are accurate and reliable for your studies and exam preparation.
2. Do I need to register or log in to download books and study guides?
No, registration is not required to access or download most resources. However, signing up for a free account can help you keep track of your downloads and access additional features.
3. How frequently is new content added to the website?
The website is updated regularly with new questions, answers, and study materials to ensure students have access to the latest information and practice resources.
4. What should I do if I notice an error in a question or answer?
If you find any mistakes, you can report them using the contact form or the “Report an Error” link provided on the page. The team reviews all feedback and makes corrections promptly.
5. Can I request specific study materials or question papers on SaraNextGen.com?
Yes, you can request specific content by contacting the support team through WhatsApp or the contact form. The team reviews all requests and prioritizes the most needed resources.
6. Is the content on SaraNextGen.com aligned with CBSE and other exam boards?
Yes, most of the content is tailored for CBSE, JEE, and NEET exams. Materials are regularly reviewed to stay updated with syllabus changes and exam patterns.
7. How can I stay updated when new content is uploaded?
You can follow SaraNextGen on social media platforms or subscribe to their newsletter to receive notifications about the latest uploads and updates.
8. Are there any premium features or paid materials?
While most of the resources are free, there are premium features like advanced test generators (details mentioned below) and downloadable guides available for registered users or through a subscription plan.
CBSE JEE NEET Test Generator | Online Question Paper Creator & Exam Generator
Looking for an efficient and user-friendly CBSE test generator? SaraNextGen offers an advanced online test and question paper generator for CBSE, JEE, NEET, and other major exams. Easily generate and download customized test papers, exam papers, and question papers in PDF format. Our platform is ideal for teachers, schools, and students, providing instant access to hundreds of exam-ready questions. Whether you need a test paper generator, online exam generator, or a question paper creator, SaraNextGen makes exam preparation simple, quick, and effective.
1. What is the CBSE Test Generator at SaraNextGen?
The CBSE Test Generator by SaraNextGen is an online platform that allows teachers and students to create customized question papers and test papers for CBSE JEET NEET classes. It supports instant generation and PDF downloads for efficient exam preparation.
2. How do I generate a test paper or question paper online?
Simply select your subject and topics on the SaraNextGen Test Generator, choose the number of questions, and instantly download your question paper in PDF format. The test paper generator supports CBSE and other competitive exams.
3. Is SaraNextGen's test generator suitable for teachers and schools?
Yes, SaraNextGen's test generator for teachers is designed for classroom, school, and coaching institute use. It enables educators to create exam papers, assignments, and practice tests quickly and efficiently.
4. Can I use the test generator for exams other than CBSE?
Absolutely! SaraNextGen supports exam paper generation for JEE, NEET, CUET, UPSC, and more, making it a versatile online exam generator for students across India.
5. Is there a limit to the number of question papers I can generate?
You can generate up to 100 questions for free and create unlimited test papers after registering on the platform, making it an ideal online test generator for regular exam preparation.
6. Does the question paper generator offer solutions and answer keys?
Yes, SaraNextGen’s question paper creator provides answer keys along with your generated test papers, ensuring comprehensive exam readiness for both teachers and students.