The voltage  and current
  graph for a conductor at two different temperatures
  and
and  are shown in the figure. The relation between
  and
and  is
is
.png)
|
a) |
|
b) |
|
c) |
|
d) |
|
Question ID - 150253 | SaraNextGen Answer The voltage and current graph for a conductor at two different temperatures and are shown in the figure. The relation between and is
a)

b)

c)

d)

The voltage and current graph for a conductor at two different temperatures and are shown in the figure. The relation between and is
|
a) |
|
b) |
|
c) |
|
d) |
|
1 Answer - 5876 Votes
3537
Answer Key : (a) -
Answer Link|
(a) Slope of the |
 curve at any point equals to resistance at that point. From the curve slope for
  slope for
 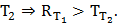 Also at higher temperature resistance will be higher so