Exercise 9.2 - Chapter 9 Correlation and Regression Analysis 11th Business Maths Guide Samacheer Kalvi Solutions - SaraNextGen [2024-2025]
Updated On May 15, 2024
By SaraNextGen
Exercise 9.2
Text Book Back Questions and Answers
Question 1.
From the data given below:
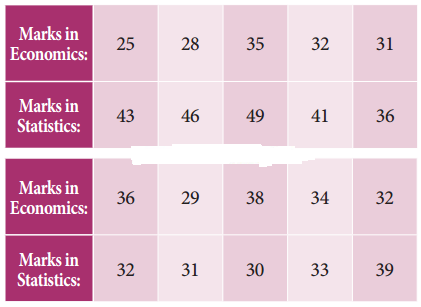
Find
(a) The two regression equations
(b) The coefficient of correlation between marks in Economics and statistics
(c) The most likely marks in Statistics when the marks in Economics is 30.
Solution:
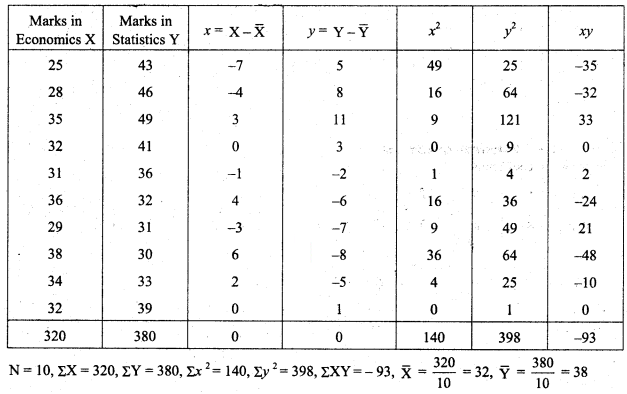
(a) Regression equation of X on Y.
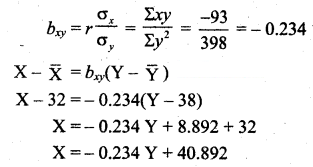
Regression equation of Y on X.
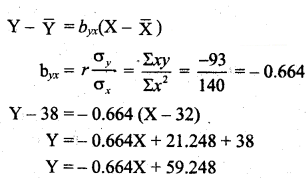
(b) Coefficient of correlation r 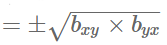
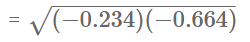
= -0.394
(c) When X = 30, Y = ?
Y = -0.664(30) + 59.248
= -19.92 + 59.248
= 39.328.
Question 2.
The heights (in cm.) of a group of fathers and sons are given below.
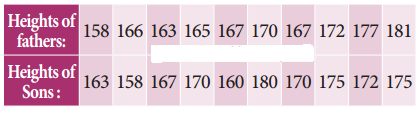
Find the lines of regression and estimate the height of son when the height of the father is 164 cm.
Solution:
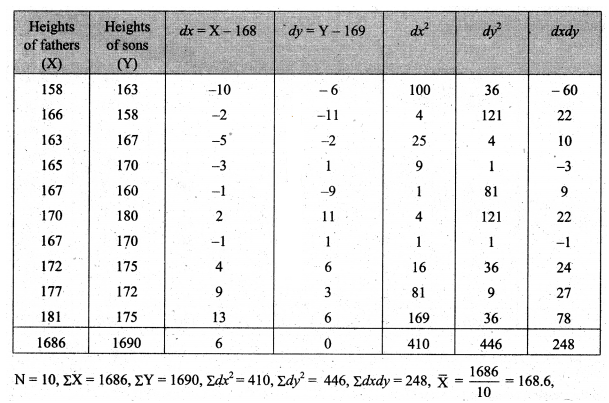
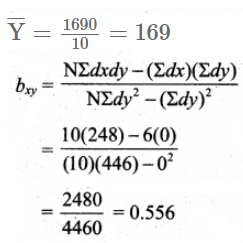
Regression equation of X on Y
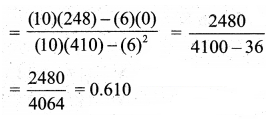

Regression equation of Y on X

Y – 169 = 0.610 (X – 168.6)
Y – 169 = 0.610X – 102.846
Y = 0.610X – 102.846 + 169
Y = 0.160X + 66.154 ………(1)
To get son’s height (Y) when the father height is X = 164 cm.
Put X = 164 cm in equation (1) we get
Son’s height = 0.610 × 164 + 66.154
= 100.04 + 66.154 cm
= 169.19 cm.
Question 3.
The following data give the height in inches (X) and the weight in lb. (Y) of a random sample of 10 students from a large group of students of age 17 years:

Estimate weight of the student of a height 69 inches.
Solution:


Regression equation of Y on X

Y – 117 = 2.3479 (X – 65.2)
Y – 117 = 2.3479X – (2.3479)(65.2)
Y = 2.3479X – 153.08308 + 117
Y = 2.3479 – 36.08308
When the height X = 69 inches
Weight, Y = 2.3479(69) – 36.08308
= 162.0051 – 36.08308
= 125.92202
= 125.92 lb
Question 4.
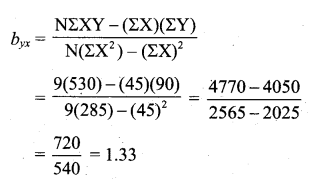
Obtain the two regression lines from the following data N = 20, ΣX = 80, ΣY = 40, ΣX2 = 1680, ΣY2 = 320 and ΣXY = 480.
Solution:
ΣX = 80, ΣY = 40, ΣX2 = 1680, ΣY2 = 320, ΣXY = 480, N = 20

Regression line of Y on X
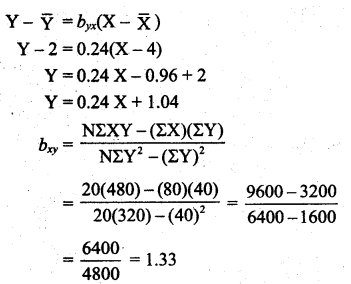
Regression line of X on Y

X – 4 = 1.33(Y – 2)
X = 1.33Y – 2.66 + 4
X = 1.33Y + 1.34
Question 5.
Given the following data, what will be the possible yield when the rainfall is 29″
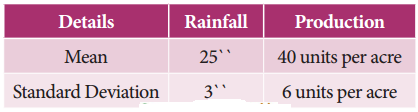
The coefficient of correlation between rainfall and production is 0.8.
Solution:
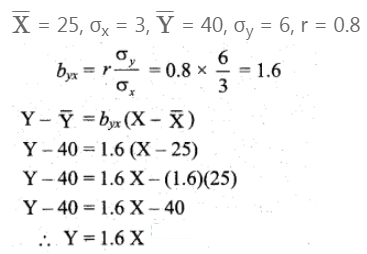
To find the yield when the rainfall is 29″ is,
Put X = 29 in the above equation we get yield,
Y = 1.6 × 29 = 46.4 units/acre
Question 6.
The following data relate to advertisement expenditure (in lakh of rupees) and their corresponding sales (in crores of rupees)
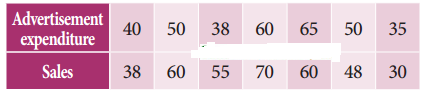
Estimate the sales corresponding to advertising expenditure of ₹ 30 lakh.
Solution:

N = 7, ΣX = 338, ΣY = 361, ΣX2 = 17094, ΣY2 = 19773, ΣXY = 18160.

Regression equation of Y on X

Y – 51.57 = 0.942(X – 48.29)
Y – 51.57 = 0.942X – 0.942 × 48.29
Y – 51.57 = 0.942X – 45.48918
Y = 0.942X + 51.57 – 48.29
Y = 0.942X + 6.081
To find the sales, when the advertising is X = 30 lakh in the above equation we get,
Y = 0.942(30) + 6.081
= 28.26 + 6.081
= 34.341
= 34.34 crores
Question 7.
You are given the following data:

If the Correlation coefficient between X and Y is 0.66, then find
(i) the two regression coefficients,
(ii) the most likely value of Y when X = 10.
Solution:
 σx = 11, σy = 8, r = 0.66
(i) The two regression coefficients are,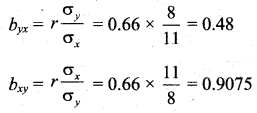
(ii) Regression equation of X on Y:
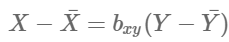
X – 36 = 0.91(Y – 85)
X – 36 = 0.91Y – 77.35
X = 0.91Y – 77.35 + 36
X = 0.91Y – 41.35
Regression line of Y on X:
Y – 85 = 0.48(X – 36)
Y = 0.48X – 17.28 + 85
Y = 0.48X + 67.72
The most likely value of Y when X = 10 is
Y = 0.48(10) + 67.72 = 72.52.
Question 8.
Find the equation of the regression line of Y on X, if the observations (Xi, Yi) are the following (1, 4) (2, 8) (3, 2) ( 4, 12) ( 5, 10) ( 6, 14) ( 7, 16) ( 8, 6) (9, 18).
Solution:

Regression line of Y on X:
Y – 10 = 1.33(X – 5)
Y = 1.33X – 6.65 + 10
Y = 1.33X + 3.35
Question 9.
A survey was conducted to study the relationship between expenditure on accommodation (X) and expenditure on Food and Entertainment (Y) and the following results were obtained:
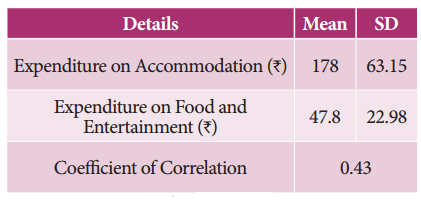
Write down the regression equation and estimate the expenditure on Food and Entertainment, if the expenditure on accommodation is ₹ 200.
Solution:
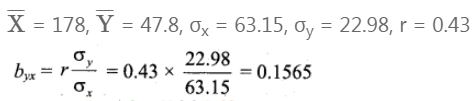
Regression line of Y on X:
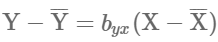
Y – 47.8 = 0.1565(X – 178)
Y = 0.1565X – 27.857 + 47.8
Y = 0.1565X + 19.94
When the expenditure on accommodation is ₹ 200 the expenditure on food and entertainments is,
Y = 0.1565X + 19.94
Y = 0.1565(200) + 19.94
= 31.3 + 19.94
= 51.24.
Question 10.
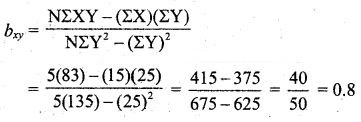
For 5 observations of pairs of (X, Y) of variables X and Y the following results are obtained.
ΣX = 15, ΣY = 25, ΣX2 = 55, ΣY2 = 135, ΣXY = 83. Find the equation of the lines of regression and estimate the values of X and Y if Y = 8; X = 12.
Solution:
N = 5, ΣX = 15, ΣY = 25, ΣX2 = 55, ΣY2 = 135, ΣXY = 83, 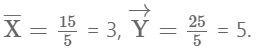
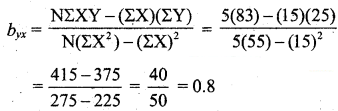
Regression line of Y on X:
Y – 5 = 0.8(X – 3)
Y = 0.8X – 2.4 + 5
Y = 0.8X + 2.6.
WhenX = 12, Y = 0.8X + 2.6
Y = (0.8)12 + 2.6
= 9.6 + 2.6
= 12.2
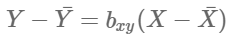
Regression line of X on Y:
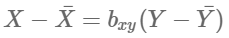
X – 3 = 0.8(Y – 5)
X = 0.8Y – 4 + 3
X = 0.8Y – 1
When Y = 8, X = 0.8Y – 1
X = (0.8)8 – 1
= 6.4 – 1
= 5.4
Question 11.
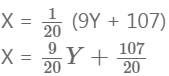
The two regression lines were found to be 4X – 5Y + 33 = 0 and 20X – 9Y – 107 = 0. Find the mean values and coefficient of correlation between X and Y.
Solution:
To get mean values we must solve the given lines.
4X – 5Y = -33 ……(1)
20X – 9Y = 107 …….(2)
(1) × 5 ⇒ 20X – 25Y = -165
20X – 9Y = 107
Subtracting (1) and (2), -16Y = -272

Using Y = 17 in (1) we get, 4X – 85 = -33
4X = 85 – 33
4X = 52
X = 13

Let regression line of Y on X be
4X – 5Y + 33 = 0
5Y = 4X + 33

Y = 0.8X + 6.6
∴ byx = 0.8
Let regression line of X on Y be
20X – 9Y – 107 = 0
20X = 9Y + 107
X = 0.45Y + 5.35
∴ bxy = 0.45
Coefficient of correlation between X and Y is
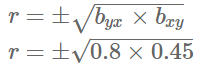
= ±0.6
= 0.6
Both byx and bxy is positive take positive sign.
Question 12.
The equations of two lines of regression obtained in a correlation analysis are the following 2X = 8 – 3Y and 2Y = 5 – X . Obtain the value of the regression coefficients and correlation coefficient.
Solution:
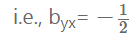
Let regression line of Y on X be,
2Y = 5 – X
Y = -0.5X + 2.5
byx = -0.5
Let regression line of X on Y be
2X = 8 – 3Y
X = -1.5Y + 4
bxy = -1.5
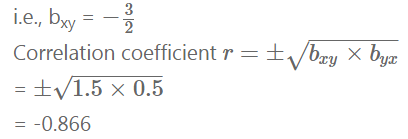
Both bxy and byx is negative so take negative sign.
Also Read : Exercise-9.3-Chapter-9-Correlation-and-Regression-Analysis-11th-Business-Maths-Guide-Samacheer-Kalvi-Solutions