Exercise 8.1 - Chapter 8 Descriptive Statistics and Probability 11th Business Maths Guide Samacheer Kalvi Solutions - SaraNextGen [2024-2025]
Updated By SaraNextGen
On April 24, 2024, 11:35 AM
Exercise 8.1
Text Book Back Questions and Answers
Question 1.
Find the first quartile and third quartile for the given observations.
2, 4, 6, 8, 10, 12, 14, 16, 18, 20, 22.
Solution:
Given data are arranged in ascending order 2, 4, 6, 8, 10, 12, 14, 16, 18, 20, 22.
Here the number of observations is n = 11

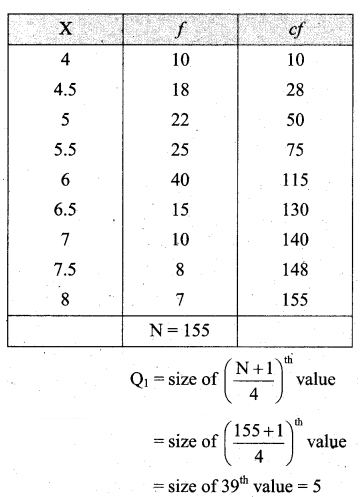
Question 2.
Find Q1, Q3, D8, and P67 of the following data:
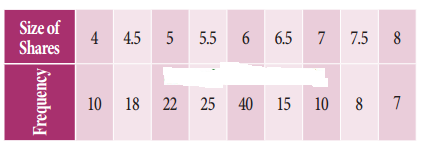
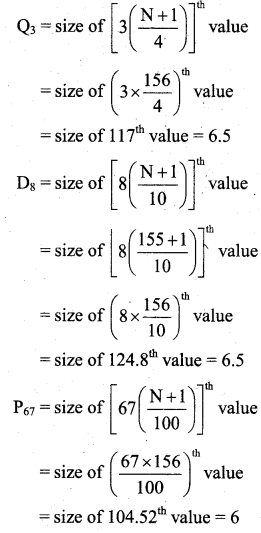
Solution:
Question 3.
Find lower quartile, upper quartile, 7th decile, 5th decile, and 60th percentile for the following frequency distribution..
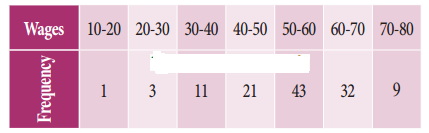
Solution:
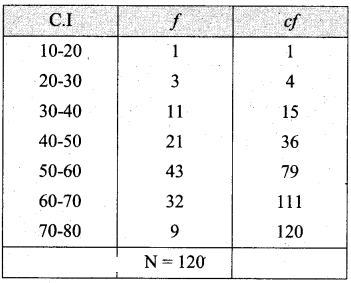
Lower quartile, Q1 = size of  value
value

= size of 30th value
Q1 lies in the class (40 – 50) and its corresponding values are L = 40,

pcf = 15, f = 21 and C = 10
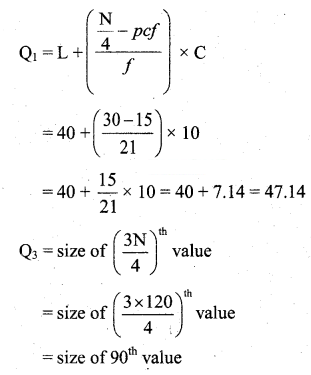
Q3 lies in the class (60 – 70) and its corresponding values are L = 60, 3N/4 = 90, pcf = 79, f = 32 and C = 10.
Thus D7 lies in the class (60 – 70) and its corresponding values are L = 60, 7N/10 = 84, pcf = 79, f = 32 and C = 10.


Thus D5 lies in the class (50 – 60) and its corresponding values are L = 50, 5N/10 = 60, pcf = 36, f = 43 and C = 10.

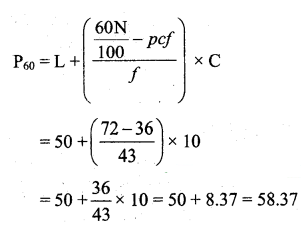
Thus P60 lies in the class (50 – 60) and its corresponding values are L = 50,  pcf = 36, f = 43 and C = 10.
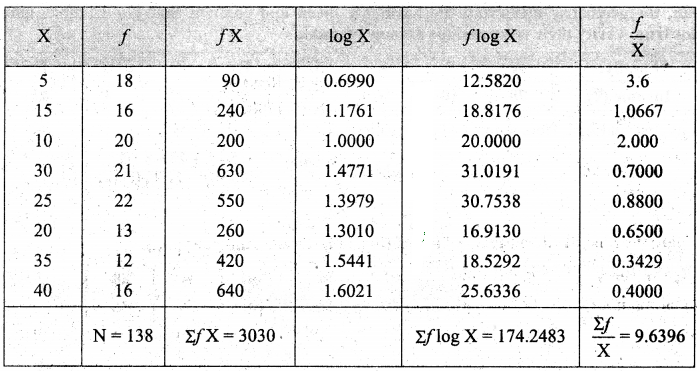
Question 4.
Calculate GM for the following table gives the weight of 31 persons in the sample survey.

Solution:
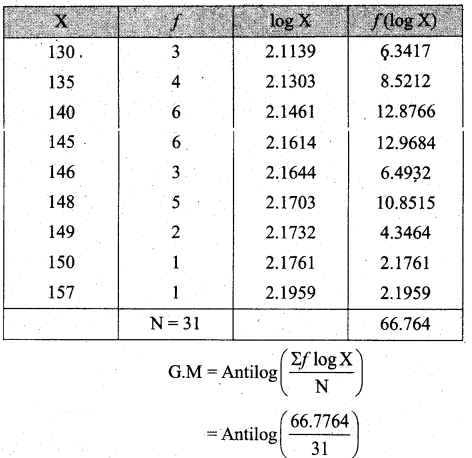
= Antilog (2.1540)
= 142.560
= 142.56 lbs
Question 5.
The price of a commodity increased by 5% from 2004 to 2005, 8% from 2005 to 2006, and 77% from 2006 to 2007. Calculate the average increase from 2004 to 2007?
Solution:
In averaging ratios and percentages, the geometric mean is more appropriate.
Let us consider X represents prices at the end of the year.

Here n = 3
= Antilog (2.1008)
= 126.1246
Average rate of increase of price = 126.1246 – 100
= 26.1246
= 26.1%
Question 6.
An aeroplane flies, along the four sides of a square at speeds of 160, 200, 300, and 400 kilometres per hour respectively. What is the average speed of the plane in its flight around the square?
Solution:
Harmonic mean would he suitable. Harmonic mean of n observations is

Question 7.
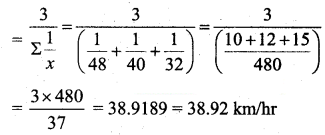
A man travelled by car for 3 days. He covered 480 km each day. On the first day, he drove for 10 hours at 48 km an hour. On the second day, he drove for 12 hours at 40 km an hour, and for the last day, he drove for 15 hours at 32 km. What is his average speed?
Solution:
Total distance covered 480 km.
The first-day distance covered 48 km.
The second-day distance covered 40 km.
Third-day distance covered 32 km.
Number of observations = 3
Average speed = HM
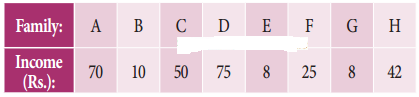
Question 8.
The monthly incomes of 8 families in rupees in a certain locality are given below. Calculate the mean, the geometric mean, and the harmonic mean and confirm that the relations among them hold true. Verify their relationships among averages.
Solution:
Let us first find AM. Here number of observations, n = 8.

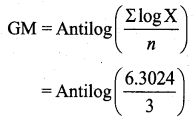
Now we will find the geometric mean. (GM)

Here number of observations is n = 8

= Antilog 1.4058
GM = 25.4566
Now we will find Harmonic Mean (HM).
Here the number of observations is n = 8.

Thus AM = 36, GM = 25.466, HM = 17.3385
36 > 25.466 > 17.3385
Hence AM > GM > HM
Thus their relations among them is verified for the given data.
Question 9.
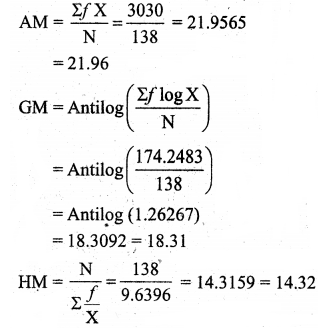
Calculate AM, GM, and HM and also verify their relations among them for the following data:

Solution:
Question 10.
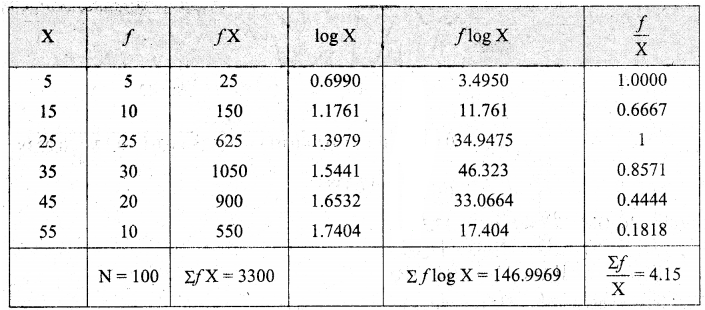
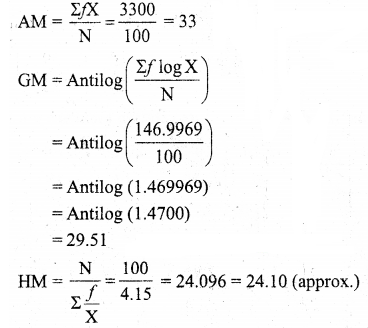
Calculate AM, GM, and HM from the following data and also find its relationship:

Solution:
Question 11.
Calculate the quartile deviation and its coefficient from the following data:
Solution:


Question 12.
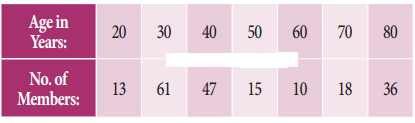
Calculate quartile deviation and its relative measure from the following data:

Solution:

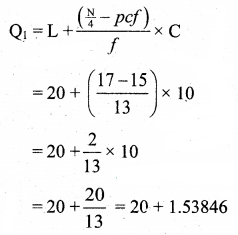
Thus Q1 lies in the class 20 – 30 and corresponding values are L = 20, N/4 = 17, pcf = 15, f = 13, C = 10.
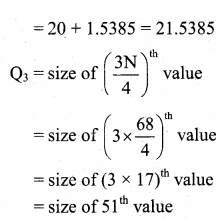
Thus Q3 lies in the class 40 – 50 and corresponding values are

pcf = 46, f = 14, C = 10

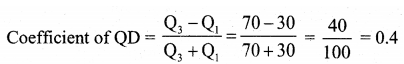
Relative measure, coefficient of QD

Question 13.
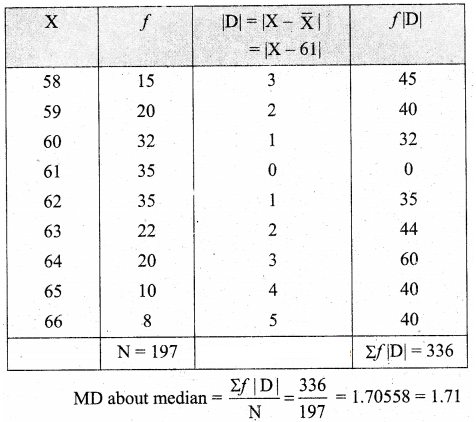
Compute mean deviation about median from the following data:
Solution:
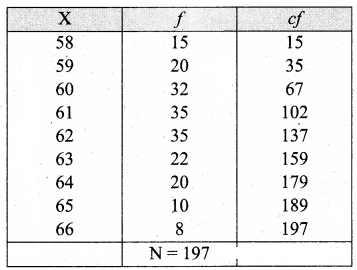
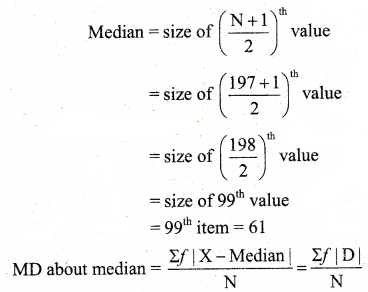
Mean deviation about median:
Question 14.
Compute the mean deviation about mean from the following data:
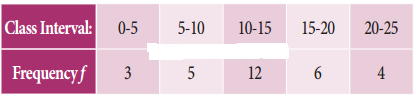
Solution:

Question 15.
Find out the coefficient of mean deviation about median in the following series:

Solution:
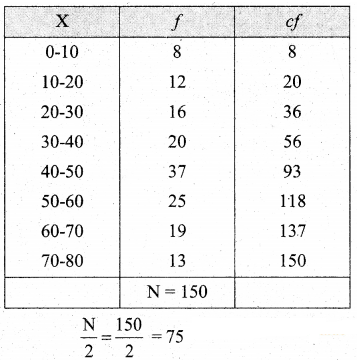
The class interval corresponding to cumulative frequency 75 is (40 – 50).
So, the corresponding values from the median class are L = 40, pcf = 56, f = 37, C = 10, N = 75.

Now we calculate the mean deviation about the median 45.11

Also Read : Exercise-9.1-Chapter-9-Correlation-and-Regression-Analysis-11th-Business-Maths-Guide-Samacheer-Kalvi-Solutions