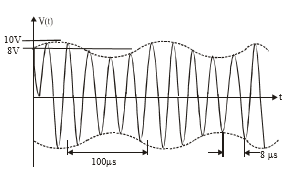
An amplitude modulated signal is plotted below:-

Which one of the following best describes the above signal?
|
a. |
(9 + sin (2.5 |
b. |
(9 + sin (4 |
|
c. |
(1 +9 sin (2 |
d. |
(9 + sin (2 |
Question ID - 50354 | SaraNextGen Answer An amplitude modulated signal is plotted below:-

Which one of the following best describes the above signal?
a.
(9 + sin (2.5 × 10⁵ t)) sin (2
 × 104t)V
b.
(9 + sin (4 × 10⁴ t)) sin (5
 × 105t)V
c.
(1 +9 sin (2  × 104 t)) sin (2.5
 × 105t)V
d.
(9 + sin (2 ×10⁴ t)) sin (2.5
 × 105t)V
An amplitude modulated signal is plotted below:-

Which one of the following best describes the above signal?
|
a. |
(9 + sin (2.5 |
b. |
(9 + sin (4 |
|
c. |
(1 +9 sin (2 |
d. |
(9 + sin (2 |
1 Answer - 5876 Votes
3537
Answer Key : (d) -
Answer LinkAnalysis of graph says
(1) Amplitude varies as 8 − 10 V or 9 ± 1
(2) Two time period as 100  s (signal wave) & 8
  s (carrier wave)
Hence signal is 

=9 4t) sin 2.5
 x 10 5 t
